Biomorphs
Posted July 2nd, 2019
In a previous post I recreate Dawkin's Weasel Program. In this post we will recreate a more visual demonstration of evolution - biomorphs.
A biomorph is a computer generated shape, with an appearance that can be influenced by a few variables. Richard Dawkins treats these variables as genes, and produces multiple biomorphs. They look like this:
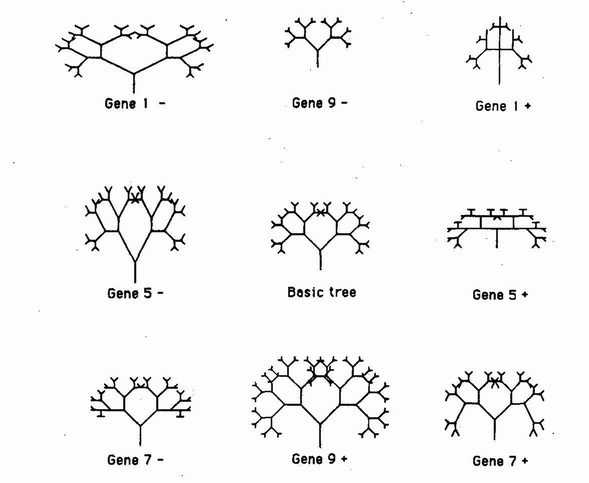
He uses them to demonstrate evolution by asking members of an audience to try to evolve their own biomorphs, by selecting the one they like the most, and cloning their "genes" multiple times, with some variation to produce biomorphs that look slightly different.
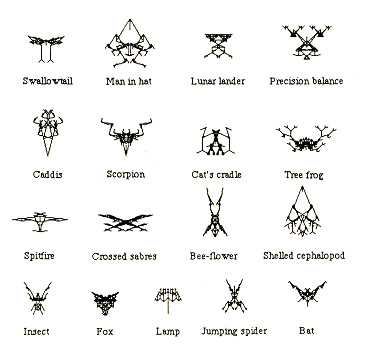
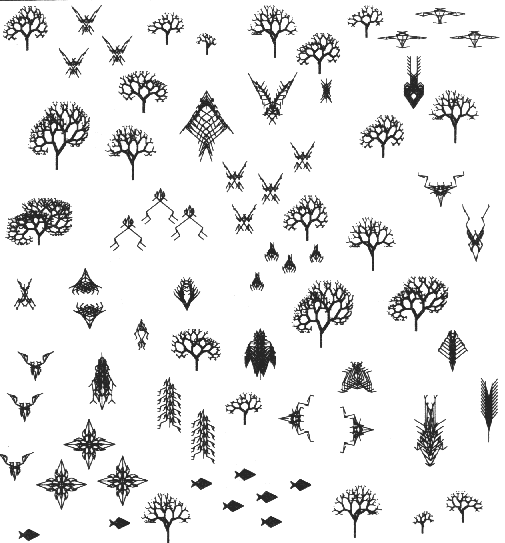
He was able to produce a large variety of different biomorphs. Here are some of his favourite:
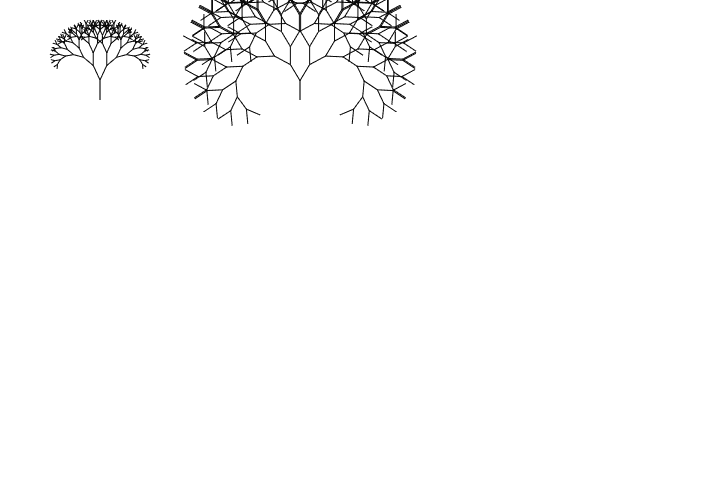
To draw his Biomorphs, Dawkins imitates embryology using recursion:
Embryonic development is far too elaborate a process to simulate
realistically on a small computer. We must represent it by some simplified analogue. We must find a simple picture-drawing rule that the computer can easily obey, and which can then be made to vary under the influence of 'genes'. What drawing rule shall we choose? Textbooks of computer science often illustrate the power of what they call 'recursive' programming with a simple tree-growing procedure. The computer starts by drawing a single vertical line. Then the line branches into two. Then each of the branches splits into two sub- branches. Then each of the sub-branches splits into sub-sub-branches, and so on. It is 'recursive' because the same rule (in this case a branching rule) is applied locally all over the growing tree. No matter how big the tree may grow, the same branching rule goes on being applied at the tips of all its twigs.
Drawing the biomorphs
I'll be using Javascript and HTML canvas to recreate Dawkin's biomorphs.
Let's start with enough HTML to get a canvas on the screen and get a rendering context. First create a file called biomorphs.html.
<!DOCTYPE html>
<html>
	<head>
		<title>Biomorphs</title>
	</head>
	<body>
	<canvas width="720" height="480" id="canvas">

	</canvas>
	<script type="text/javascript">
		var canvas = document.getElementById("canvas");
		var ctx = canvas.getContext("2d");


	</script>

	<style type="text/css">
		canvas {
			border: thin solid black;
		}
	</style>

	</body>
</html>
Now I will make a javascript function to create biomorphs. First we write the code to draw a line at 45 degrees. If we have a line with length s, and a angle of a, and a starting position of x and y, then the final position, according to trigonometry, is and .
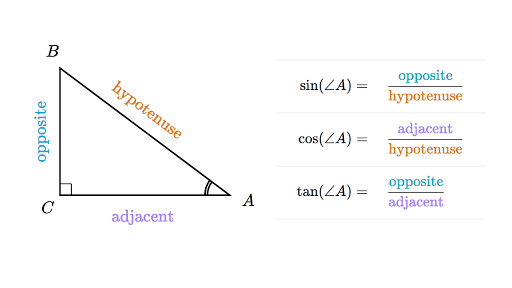
In our case, however, since the origin of the canvas coordinate system is on the top left, we will be using so the angles appear as expected.
var canvas = document.getElementById("canvas");
var ctx = canvas.getContext("2d");

function toRadians(angle) {
	return angle * Math.PI / 180;
}

function drawLine(x, y, endX, endY) {
	ctx.beginPath();
	ctx.moveTo(x, y);

	ctx.lineTo(endX, endY);
	ctx.stroke();
}

function drawBranch(x, y) {
	var endX = x + Math.sin(toRadians(45)) * 40;
	var endY = y - Math.cos(toRadians(45)) * 40;

	drawLine(x, y, endX, endY);
}

drawBranch(100, 100);
Since the sin and cos functions in Javascript use radians, I've created a helper function that converts degrees to radians. This is because people tend to prefer degrees, and 360 is divisible by many whole numbers, allowing for the easy creation of variety of biomorphs.
I've also created a function to draw a line between two points, since that does not exist in Javascript canvas.
Running them in the browser should show this:

Now let's remove the hard-coded values for the angle:
function drawBranch(x, y, size, angle) {
	var endX = x + Math.sin(toRadians(angle)) * size;
	var endY = y - Math.cos(toRadians(angle)) * size;

	drawLine(x, y, endX, endY);
}

drawBranch(100, 100, 40, 45);
After drawing the first line, two more lines should to branch from the end.
Like this:

Before we go about making this function recursive, let's try to implement it by hand.
function drawBranch(x, y, size, angle) {
	var endX = x + Math.sin(toRadians(angle)) * size;
	var endY = y - Math.cos(toRadians(angle)) * size;

	drawLine(x, y, endX, endY);

	x = endX;
	y = endY;


	endX = x + Math.sin(toRadians(angle+angle)) * size;
	endY = y - Math.cos(toRadians(angle+angle)) * size;

	drawLine(x, y, endX, endY);

	endX = x + Math.sin(toRadians(angle-angle)) * size;
	endY = y - Math.cos(toRadians(angle-angle)) * size;

	drawLine(x, y, endX, endY);


	}
Most of the code is repeated. The difference is the angle has changed. The first branch is 45 degrees to the left, and the other branch it is 45 degrees to the right.
This means we only have to modify the angle when calling recursively, and add a base condition to return when the number of iterations has been met to prevent an infinite loop.
function drawBranch(x, y, size, angle, angleDiff, iterations) {
	if (iterations == 0) return;
	var endX = x + Math.sin(toRadians(angle)) * size;
	var endY = y - Math.cos(toRadians(angle)) * size;

	drawLine(x, y, endX, endY);

	drawBranch(endX, endY, size, angle+angleDiff, angleDiff, iterations-1);
	drawBranch(endX, endY, size, angle-angleDiff, angleDiff, iterations-1);
}

drawBranch(100, 100, 40, 45, 45, 2);
Now, by changing the number of iterations, we have a whole new image.
function drawBranch(x, y, size, angle, angleDiff, iterations) {
	if (iterations == 0) return;
	var endX = x + Math.sin(toRadians(angle)) * size;
	var endY = y - Math.cos(toRadians(angle)) * size;

	drawLine(x, y, endX, endY);

	drawBranch(endX, endY, size, angle+angleDiff, angleDiff, iterations-1);
	drawBranch(endX, endY, size, angle-angleDiff, angleDiff, iterations-1);
}

drawBranch(100, 200, 40, 0, 45, 3);
drawBranch(300, 200, 40, 0, 45, 4);
drawBranch(500, 400, 40, 0, 45, 5);
function drawBranch(x, y, size, angle, angleDiff, iterations) {
	if (iterations == 0) return;
	var endX = x + Math.sin(toRadians(angle)) * size;
	var endY = y - Math.cos(toRadians(angle)) * size;

	drawLine(x, y, endX, endY);

	drawBranch(endX, endY, size*0.8, angle+angleDiff, angleDiff, iterations-1);
	drawBranch(endX, endY, size*0.8, angle-angleDiff, angleDiff, iterations-1);
}


drawBranch(50, 200, 20, 0, 45, 3);
drawBranch(150, 200, 20, 0, 45, 4);
drawBranch(250, 200, 20, 0, 45, 5);
drawBranch(350, 200, 20, 0, 45, 6);
drawBranch(470, 200, 20, 0, 45, 8);

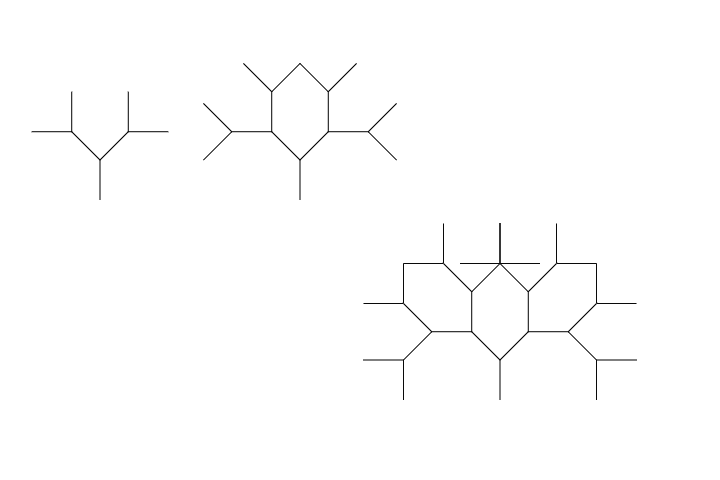
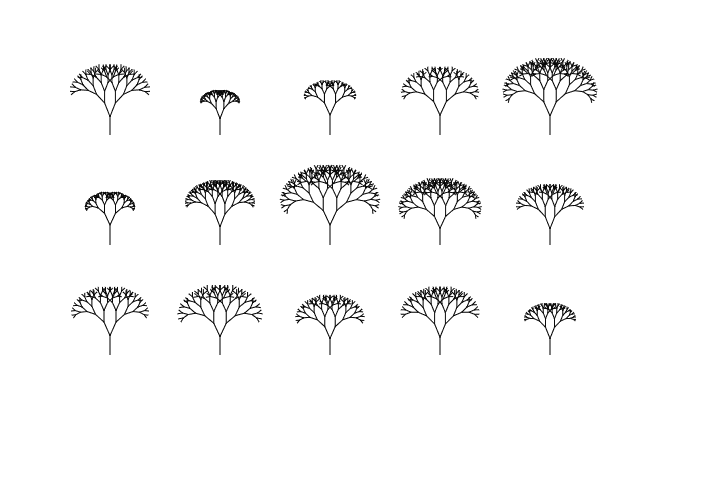
Now replace the drawBranch calls with:
var i = 0;
for (var row = 1; row < 5; row++) {
	for (var col = 1; col < 6; col++) {
		i++;
		drawBranch(col * 110, row * 110, 20, 0, i*6, 8);
	}
}

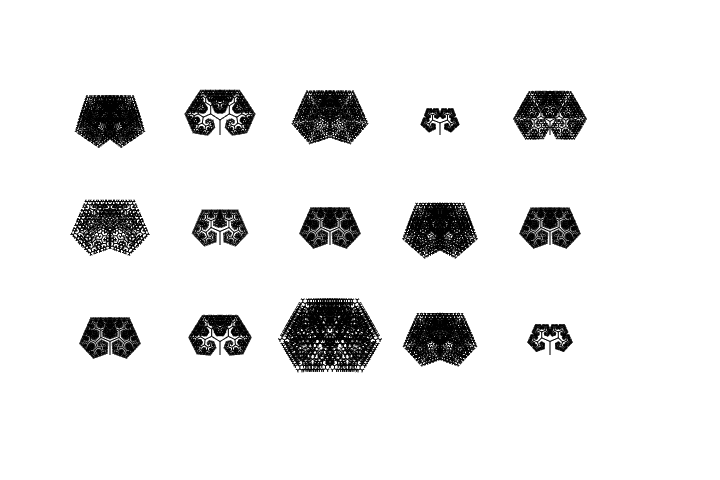
One last gene - the size factor:
function drawBranch(x, y, size, sizeFactor, angle, angleDiff, iterations) {
	if (iterations == 0) return;
	var endX = x + Math.sin(toRadians(angle)) * size;
	var endY = y - Math.cos(toRadians(angle)) * size;

	drawLine(x, y, endX, endY);

	drawBranch(endX, endY, size*sizeFactor, sizeFactor, angle+angleDiff, angleDiff, iterations-1);
	drawBranch(endX, endY, size*sizeFactor, sizeFactor, angle-angleDiff, angleDiff, iterations-1);
}


var i = 0;
for (var row = 1; row < 5; row++) {
	for (var col = 1; col < 6; col++) {
		i++;
		drawBranch(col * 110, row * 110, 20, 0.8, 0, i*6, 8);
	}
}
Remember, every change to the parameters that drawBranch accepts means we have to pass it in when calling it.
The evolution bit
Now we have a function that, given some parameters, can draw many different shapes. But we have no way of evolving it yet. To do that, we will need a concept of genes. I'll use arrays to replicate this. First I will create a Biomorph class that takes in an array of genes.
const GENE_INDICIES = {
	SIZE: 0,
	SIZE_FACTOR: 1,
	ANGLE_DIFF: 2,
	ITERATIONS: 3
};

class Biomorph {
	constructor(genes) {
		this.genes = genes;
	}

	draw(x, y) {
		drawBranch(
			x, y,
			this.genes[GENE_INDICIES.SIZE],
			this.genes[GENE_INDICIES.SIZE_FACTOR],
			0,
			this.genes[GENE_INDICIES.ANGLE_DIFF],
			this.genes[GENE_INDICIES.ITERATIONS]
		);
	}
}
Now replace the loop for drawing the branches with this:
var biomorph = new Biomorph([20, 0.8, 25, 8]);
biomorph.draw(100, 100);
And running it should show this:

Now let's add the ability to "reproduce" a biomorph:
reproduce() {
	var newGenes = [];

	for (var i = 0; i < this.genes.length; i++) {
		var geneValue = this.genes[i];
		var difference = Math.random() * 0.3 - 0.15;
		if (Math.random() * 100 > 20) geneValue *= 1 + difference;
		newGenes.push(geneValue);
	}

	return new Biomorph(newGenes);
}
We change a value by no more than 25%.
To make this work we also have to make sure the genes stay within valid ranges - otherwise they get too big:
draw(x, y) {
	drawBranch(
		x, y,
		Math.min(this.genes[GENE_INDICIES.SIZE], 30),
		Math.min(this.genes[GENE_INDICIES.SIZE_FACTOR], 0.9),
		0,
		this.genes[GENE_INDICIES.ANGLE_DIFF],
		Math.min(Math.round(this.genes[GENE_INDICIES.ITERATIONS]), 12)
	);
}
Now we can test this by creating a biomorph and reproducing it then drawing both to the screen.
var biomorph = new Biomorph([20, 0.8, 25, 8]);
biomorph.draw(100, 100);

var child = biomorph.reproduce();
child.draw(300, 100);
Next we need to fill a grid with child biomorphs.
First let's create a method to populate the grid. In this method we set add the parent biomorph to the middle cell, and add children of the parent in all other cells.
function populateGrid(parent) {
	var grid = Array.from(Array(3), () => new Array(5));
	for (var y = 0; y < grid.length; y++) {
		for (var x = 0; x < grid[y].length; x++) {
			if (y == (grid.length+1)/2 - 1 && x == (grid[y].length+1)/2 - 1) {
				grid[y][x] = parent;
			} else {
				grid[y][x] = parent.reproduce();
			}
		}
	}
	return grid;
}
This takes in a parent so that when we select a biomorph, we create a new grid with the selected biomorph as the parent.
function drawGrid() {
	for (var y = 0; y < grid.length; y++) {
		for (var x = 0; x < grid[y].length; x++) {
			grid[y][x].draw((x+1) * 110, (y+1) * 110 + 25);
		}
	}
}
var biomorph = new Biomorph([20, 0.8, 25, 8]);
grid = populateGrid(biomorph);
drawGrid();
Next we need a way to select a biomorph. We'll do this by adding an event handler to the canvas.
canvas.addEventListener('click', function (evt) {


});
To get the mouse coordinates relative to the canvas, we get the clientX and clientY from the event.
canvas.addEventListener('click', function (evt) {
	var x = evt.clientX;
	var y = evt.clientY;
});
And to convert from the x and y coordinates to indices in the grid, we offset the coordinates and divide by the size of the cell.
canvas.addEventListener('click', function (evt) {
	var x = evt.clientX;
	var y = evt.clientY;
	var col = Math.floor((x - 55)/110);
	var row = Math.floor((y - 55)/110);


});
Now that we have the indices in the grid, all we have to do is extract the selected biomorph, repopulate the grid using that biomorph as the parent, and redraw the grid. We also have to check that the row and column are valid indices within the grid:
canvas.addEventListener('click', function (evt) {
	var x = evt.clientX;
	var y = evt.clientY;
	var col = Math.floor((x - 55)/110);
	var row = Math.floor((y - 55)/110);
	if (row >= 0 && row < grid.length && col >= 0 && col < grid[row].length) {
		var parent = grid[row][col];
		grid = populateGrid(parent);
		drawGrid();
	}

});
To prevent the previous biomorphs from being drawn over, we clear the canvas:
function drawGrid() {
	ctx.clearRect(0, 0, canvas.width, canvas.height);
	for (var y = 0; y < grid.length; y++) {
		for (var x = 0; x < grid[y].length; x++) {
			grid[y][x].draw((x+1) * 110, (y+1) * 110 + 25);
		}
	}
}

Next Steps
This is enough to demonstrate the general principle but there is a lot more that could be done. For example, by adding "segmentation", and playing with symmettry and adding a gradient scale, Dawkins was able to create much more complex shapes:
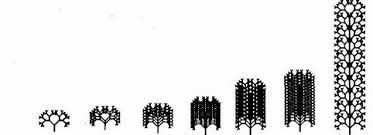
Another way we could extend it is by saving a selected biomorph - that's something Richard Dawkins decided to do after trying to recreate a biomorph.